Newcastle house prices by suburb: what a house costs in 2026

The typical Newcastle house sold for $1,080,000 in the year to June, up 11.5 per cent on the year before.
Newcastle at a glance
- Typical house
- $1,080,000 up 11.5 per cent in a year
- Sold for $1m or more
- 59 per cent 47 per cent a year earlier
- Houses sold
- 2,276 in the year to June
Why it matters: your house is probably your biggest asset, and the public record shows what it is really worth, not what an ad says.
What houses sold for in your suburb
Choose your suburb to see its typical house price and the latest sales on record.
| Latest sales | Price | Sold |
|---|
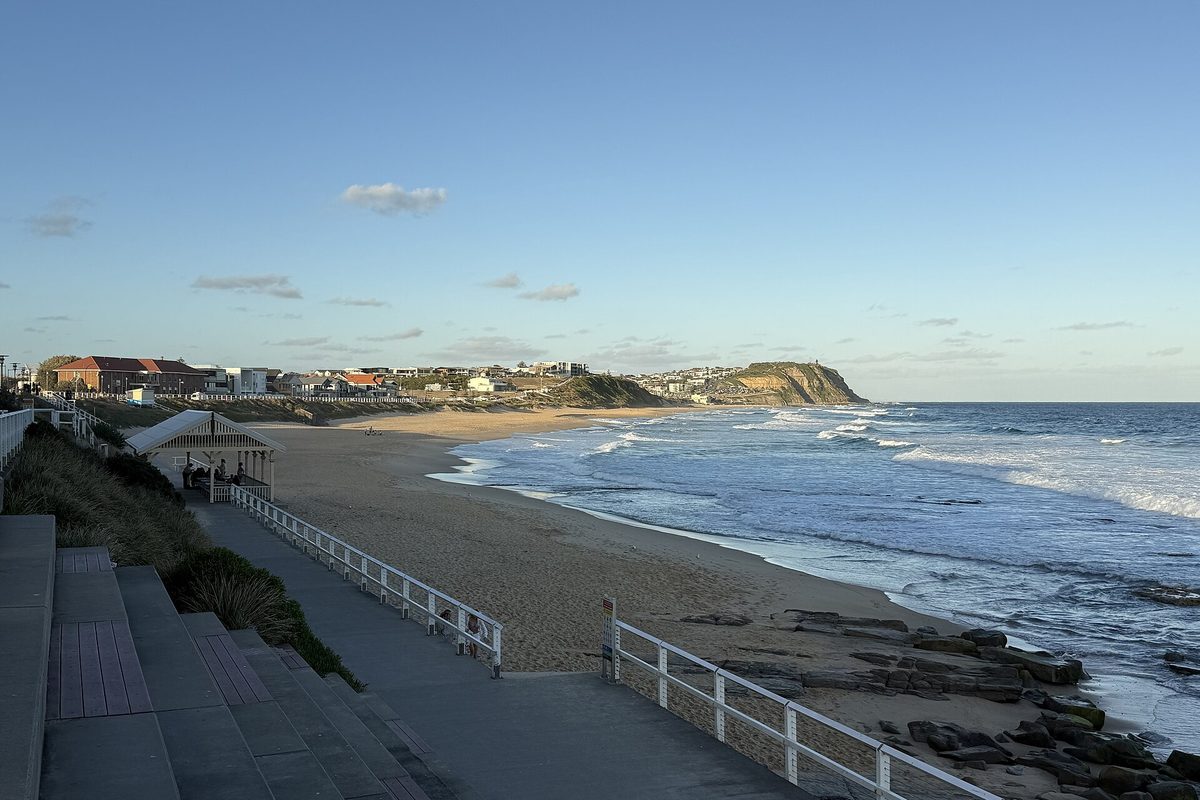
The typical house in Beresfield sold for $775,000 in the year to June, up 74 per cent in five years. Merewether, the dearest suburb with steady sales, rose 30 per cent over the same five years.
It is the clearest sign of a pattern that runs right across the city: the cheaper a suburb was in 2021, the faster its prices have grown since.
The figures come from the NSW Valuer General's record of every house sale in the City of Newcastle, worked through by hunternew.
Are house prices falling in Newcastle?
No.
The typical Newcastle house sold for $1,080,000 in the year to June, up 11.5 per cent on the year before.
Prices rose in 35 of the 42 suburbs with enough sales to compare.
The last real dip came in the second half of 2022, when interest rates climbed, and prices did not pass their early 2022 level again until 2024.
Six in 10 houses now sell for $1 million or more (59 per cent). A year earlier it was 47 per cent.
The cheap suburbs beating the beach
Split Newcastle's suburbs into three groups by what a house cost in 2021, and the pattern is plain.
The typical house in the cheapest third of suburbs rose 58 per cent over five years.
The middle third rose 51 per cent, and the dearest third, mostly beach and inner-city suburbs, 45 per cent.
Beresfield (up 74 per cent), Tarro (up 70 per cent), Birmingham Gardens (up 70 per cent) and Fletcher (70 per cent) led the city.
At the other end, Warabrook (26), Carrington (28) and Merewether (30 per cent) grew the least.
| Fastest | 2021 | 2026 | Change |
|---|---|---|---|
| Beresfield | $445,000 | $775,000 | +74% |
| Tarro | $440,000 | $750,000 | +70% |
| Birmingham Gardens | $525,000 | $890,000 | +70% |
| Fletcher | $625,000 | $1,060,000 | +70% |
| Slowest | |||
| Warabrook | $782,500 | $985,000 | +26% |
| Carrington | $776,000 | $990,000 | +28% |
| Merewether | $1,686,000 | $2,200,000 | +30% |
Why the cheaper suburbs are catching up
Three things are pushing the same way, on hunternew's reading of the numbers.
First, buyers priced out of the beach and the inner city are moving one ring out.
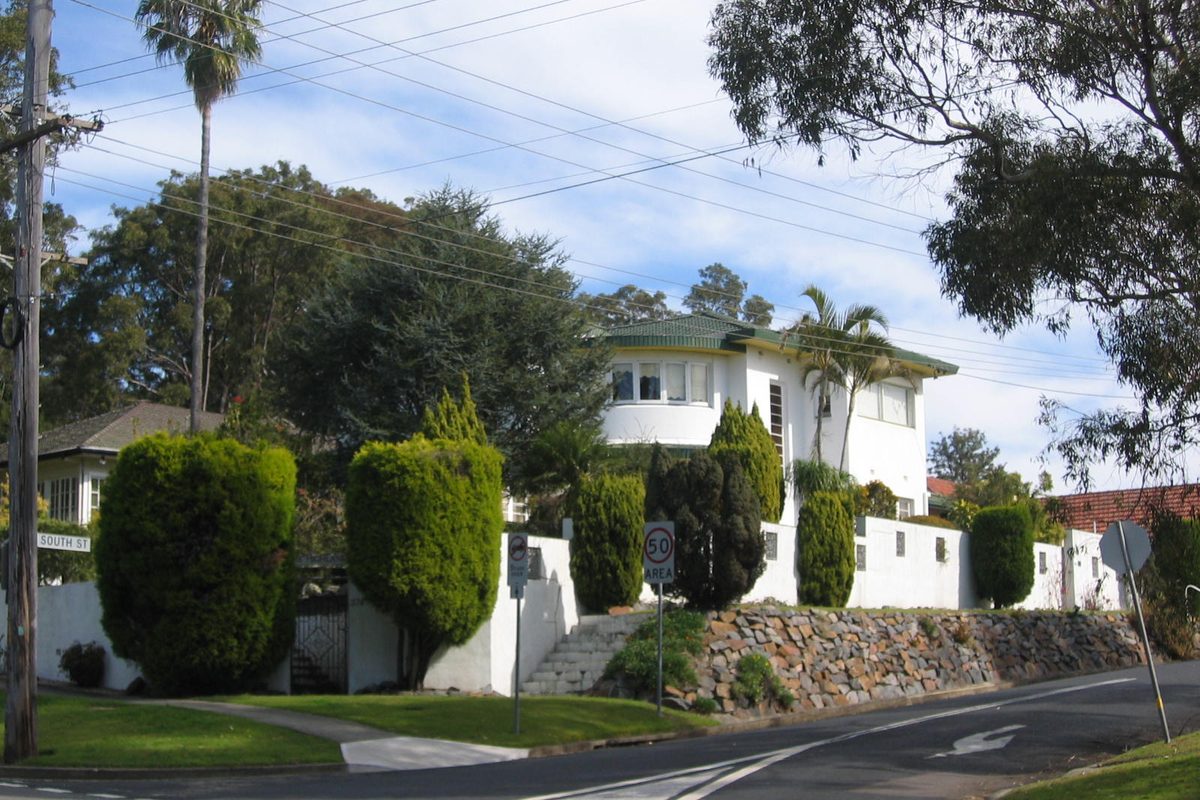
Second, land in those suburbs is cheap. A typical house in Beresfield works out at about $1,202 for each square metre of land, against about $8,607 in Cooks Hill.
That matters more since NSW began allowing two homes on many ordinary house blocks, which can make a big block worth more than the house on it (where dual occupancies are being built in Newcastle).
Third, they started low. A $100,000 rise is 22 per cent on a $445,000 house, but 6 per cent on a $1.69 million one.
Growth that fast can stall. When rates rose in 2022, prices across the city went backwards for more than a year.
What your budget buys
Choose a budget to see the suburbs where the typical house sold for that or less in the past year.
The cheapest suburbs in Newcastle
Of the suburbs with steady sales, Tarro had the lowest typical house price, at $750,000.
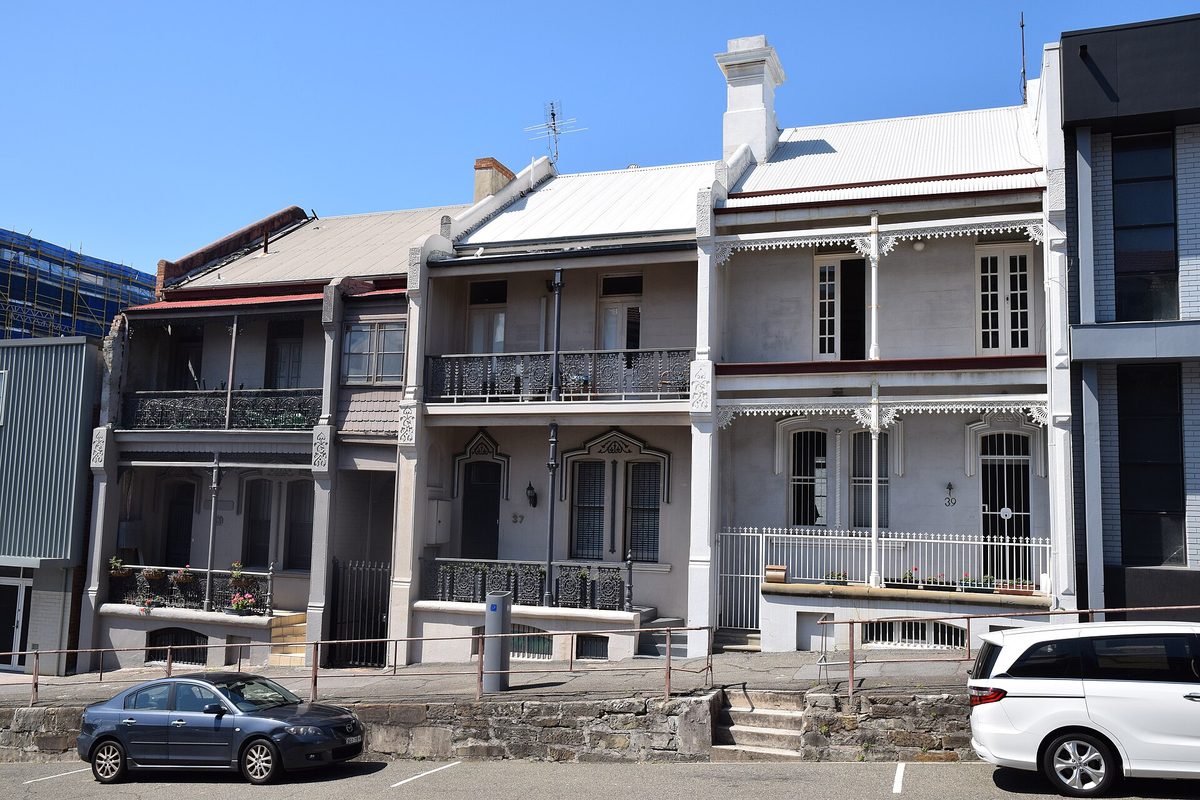
Most of the cheapest suburbs are in the west and north-west, and most come with a big block.
| Suburb | Typical house | Typical block |
|---|---|---|
| Tarro | $750,000 | 607 m² |
| Beresfield | $775,000 | 645 m² |
| Shortland | $825,000 | 569 m² |
| Jesmond | $857,500 | 564 m² |
| Wallsend | $887,444 | 588 m² |
| Birmingham Gardens | $890,000 | 620 m² |
The most expensive suburbs in Newcastle
Merewether is Newcastle's dearest suburb with steady sales, with a typical house at $2,200,000.
Cooks Hill ($1.89 million), Hamilton South ($1.49 million) and Broadmeadow ($1.43 million) follow.
A few suburbs with only a handful of sales a year, such as Bar Beach, The Junction, The Hill and Hamilton East, sit higher still.
The dearest house sale on record in the past year was $9.3 million, in Merewether.
Is Newcastle going to boom?
Nobody can say for sure, and sale records show what has happened, not what will.
If the past five years are a guide, the suburbs to watch are those still under $900,000 with big blocks and steady sales: Tarro, Beresfield, Shortland, Jesmond, Wallsend and Birmingham Gardens.
Interest rates, building costs and the number of new homes approved will all have a say, and none of them show up in sale records.
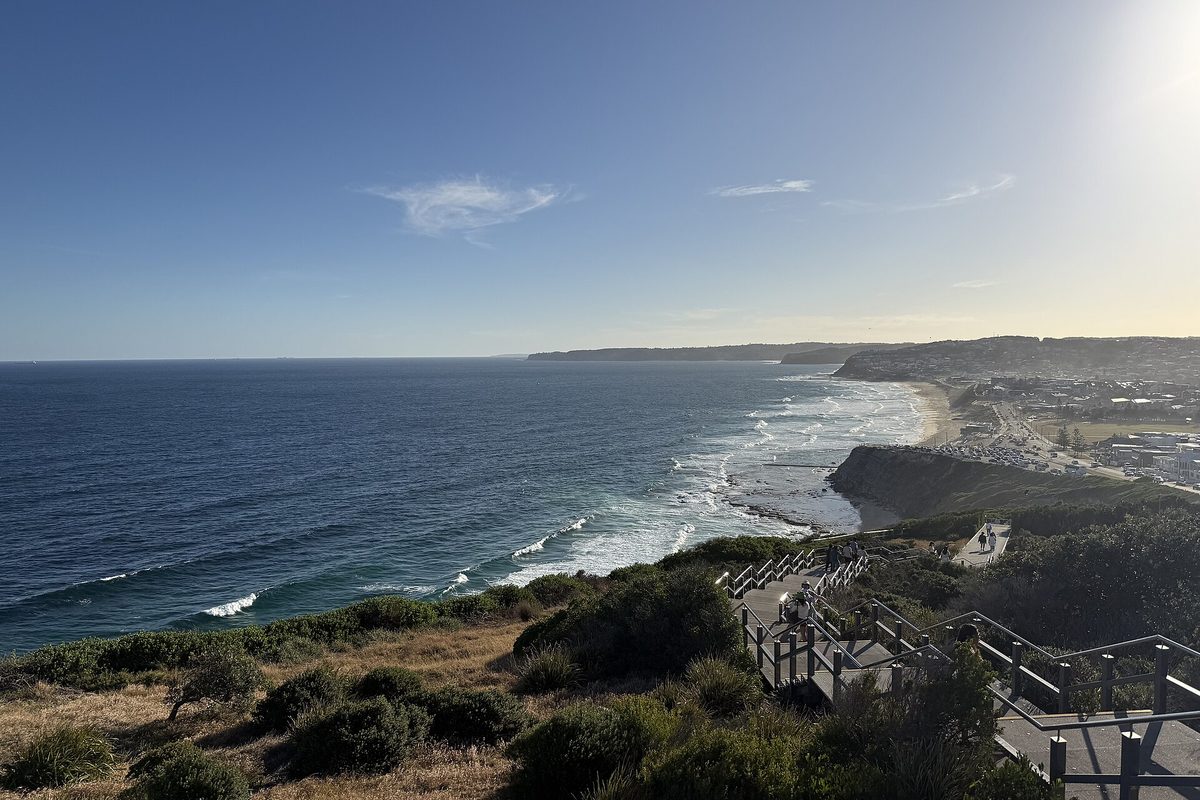
Our read: the cheaper suburbs of the west and north-west have more room to grow, because land there is still cheap and blocks are big.
Yes, but: fast growth can stall. When rates rose in 2022, prices across the city fell for more than a year.
What happens next: hunternew follows Newcastle house sales in the NSW Government's public sale records.
The bottom line: look up your own suburb, and judge your house by what sold, not by what is listed.
Every suburb
Show the typical house price in all 43 suburbs
| Suburb | Typical house | 1 year | Sales |
|---|---|---|---|
| Minmi * | $630,000 | +5% | 13 |
| Tarro | $750,000 | +13% | 34 |
| Beresfield | $775,000 | +17% | 63 |
| Shortland | $825,000 | +15% | 53 |
| Jesmond | $857,500 | +10% | 36 |
| Wallsend | $887,444 | +11% | 184 |
| Birmingham Gardens | $890,000 | +19% | 53 |
| Maryland | $920,000 | +15% | 98 |
| Elermore Vale | $926,500 | -2% | 58 |
| Waratah West | $955,500 | +12% | 50 |
| Waratah | $982,750 | +8% | 58 |
| Rankin Park | $984,000 | +16% | 54 |
| Warabrook * | $985,000 | +0% | 19 |
| Carrington | $990,000 | +0% | 40 |
| North Lambton | $1,022,500 | +19% | 58 |
| Mayfield West | $1,025,000 | +24% | 25 |
| Islington | $1,040,000 | +13% | 27 |
| Mayfield | $1,050,000 | +12% | 177 |
| Fletcher | $1,060,000 | +12% | 101 |
| Kotara | $1,065,000 | +10% | 62 |
| Hamilton North * | $1,100,000 | +19% | 13 |
| Mayfield East | $1,100,000 | +19% | 33 |
| Hamilton | $1,150,000 | +4% | 63 |
| Wickham * | $1,150,000 | +29% | 13 |
| Georgetown | $1,165,000 | +27% | 39 |
| Adamstown | $1,230,000 | +14% | 71 |
| Maryville | $1,240,000 | +16% | 29 |
| Lambton | $1,250,000 | +15% | 67 |
| Stockton | $1,250,000 | +0% | 73 |
| New Lambton Heights | $1,252,000 | +3% | 41 |
| Tighes Hill | $1,280,000 | +6% | 25 |
| Adamstown Heights | $1,312,500 | +18% | 104 |
| New Lambton | $1,317,500 | +11% | 144 |
| Broadmeadow | $1,428,000 | +44% | 20 |
| Hamilton South | $1,490,000 | -21% | 38 |
| Merewether Heights * | $1,655,000 | -3% | 19 |
| Cooks Hill | $1,885,000 | +19% | 28 |
| Hamilton East * | $2,040,000 | +26% | 19 |
| The Hill * | $2,097,500 | -4% | 14 |
| The Junction * | $2,137,500 | +8% | 8 |
| Merewether | $2,200,000 | +0% | 134 |
| Newcastle East * | $2,630,000 | 7 | |
| Bar Beach * | $4,250,000 | +28% | 7 |
* Fewer than 20 sales in the year, so treat as rough.
How the numbers were worked out
Every house sale in NSW is reported to the NSW Valuer General, which publishes the list each week.
We count a sale as a house when it has its own block of 100 square metres or more and no unit number.
We leave out sales under $300,000, which are usually part shares or family transfers, and over $15 million, which are usually whole development sites.
The typical price is the median: half the houses sold for more, half for less. The year runs to 30 June 2026, because sales take a few weeks to reach the record.
More: House flipping in Newcastle: what 35 real flips made · Dual occupancy in Newcastle